 |
| Outline |
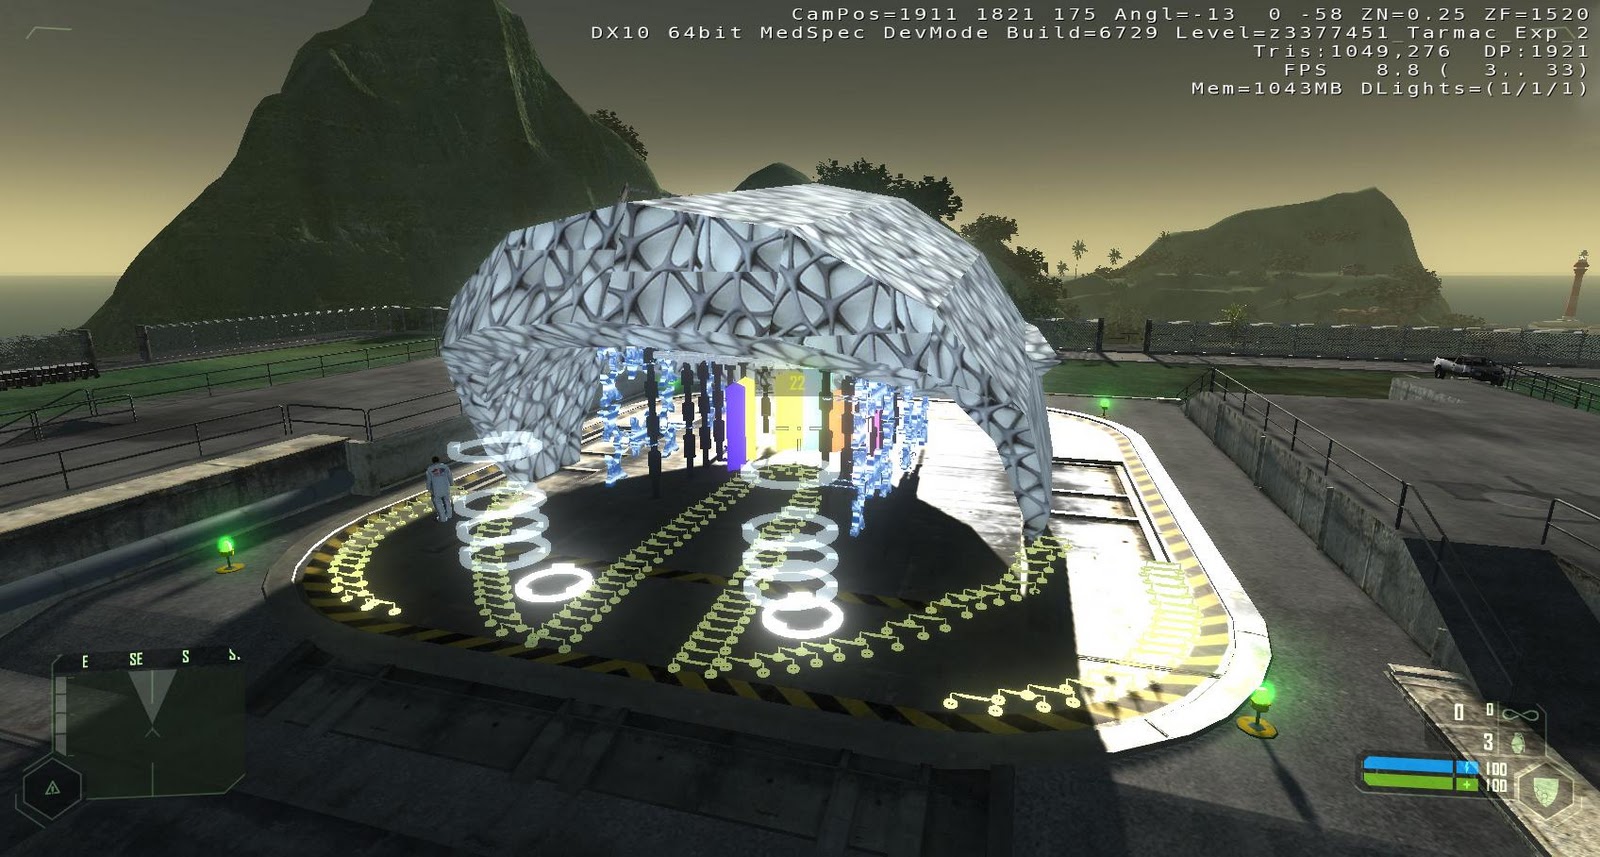
The model I am going to create is a laboratory with different equipment, according to the chosen pachube feed data, those equipment will respond the viewer through graphical way such as glow, increase the equipment density or increase the length, and read the data from xml which provided by the chosen pachube feed. There have three types of data in the chosen pachube feed: Temperature, Light, and Time. The laboratory therefore will be given three equipments, they are spinning time sensor rings, light sensor sticks and triangular bars to represent those different data, meanwhile, at the time the model react some movement to the viewer, they also would show the data from the live feed. In this pachube feed, the light actually is the key, people are sensitive to light, and more importantly, with some more addition effect, the light would make the installation distinct and significant. This model therefore will have some lighting effects through flow graphs to demonstrate several variations and movements when analysis the data from updated pachube feed.
 |
| DatasNOverall |
The first data is the temperature, in the laboratory, the triangular bars will analysis the variation in the data and then convert the data into bar graph. The graph will increase its length with a certain speed to a certain height, depending on the numerical data, display the data and start glowing.
 |
| TemperatureBars |
The second data is the light data. They will be gathered by the light sensor sticks and displayed as integer data when these sticks start glowing through HUD massage. The sensor sticks will also be lined up on the ground to show the dimension of the data with different levels of glowing and the length of the glowing sticks (if the data is not great enough, some of the light sensor sticks will not glow until the data gets a certain level).
 |
| StickSensors(W/O data) |
The last equipment will be measuring the time. Because of the time is dynamic, therefore the equipment it is assigned is also dynamic. That will be the spinning time sensor rings. They are spinning around within an area, displaying the data with the HUD massage, and also increase the density when the data gets certain level. When the data change, these rings will have some flash effect as response.
 | ||
| SpinningRings(W/O data) |
Chosen Pachube Feed
https://pachube.com/feeds/35441
Three 30 second(max) video clips demostrating flowgraph analysis
Draft Video_3
Reading updated Pachube feed
Analysis data
Time data
Flowgraphs_Time_data_Reading_and_Change_Time:
 | |
| Overall |
 |
| Part_1 |
 |
| Part_2 |
Draft Video_2
Reading updated Pachube feed
Analysis data
Light data
 |
| Duplicate_This_for_Each_Stick_Sensor_Then_Change_the_Value_order |
Draft Video_1
Reading XML document
Temperature Analysis
Temperature Analysis
Flowgraphs_Temperature_xml_Reading:


No comments:
Post a Comment